
At PLEQ, we believe that high-accuracy sensing technology forms the basis of various smart campus use cases, particularly for teaching spaces. But what is high accuracy? How do we determine it? In this blog post, we guide you through our view on assessing sensor accuracy for occupancy measurement.

Bart Valks

Measuring frequency and occupancy
Let’s start with what we are trying to measure. Using sensing technology, we want to understand the frequency rate and occupancy rate of spaces on your campus. These are defined as follows:
The frequency is the time a space is in use relative to its availability,
The occupancy is the number of people using the room relative to its capacity.
At the level of a single measurement, this means that we want to understand the following variables:
Frequency: Is the room in use (yes or no)
Occupancy: How many people are using the room (people count)
From many measurements to lesson or meeting statistics
With real-time measurement, we then need to aggregate multiple measurements to determine the frequency and occupancy of meetings or teaching classes. Let’s say that a meeting has a one-hour duration. If the sensor measures every minute, than we have to derive the frequency and occupancy of that meeting from 60 measurements!
With people counting sensors, we start by mapping the people count across a whole meeting. This looks like the example below: the people count starts at 46, peaks at 116, and after 50 minutes decreases to nearly 0.
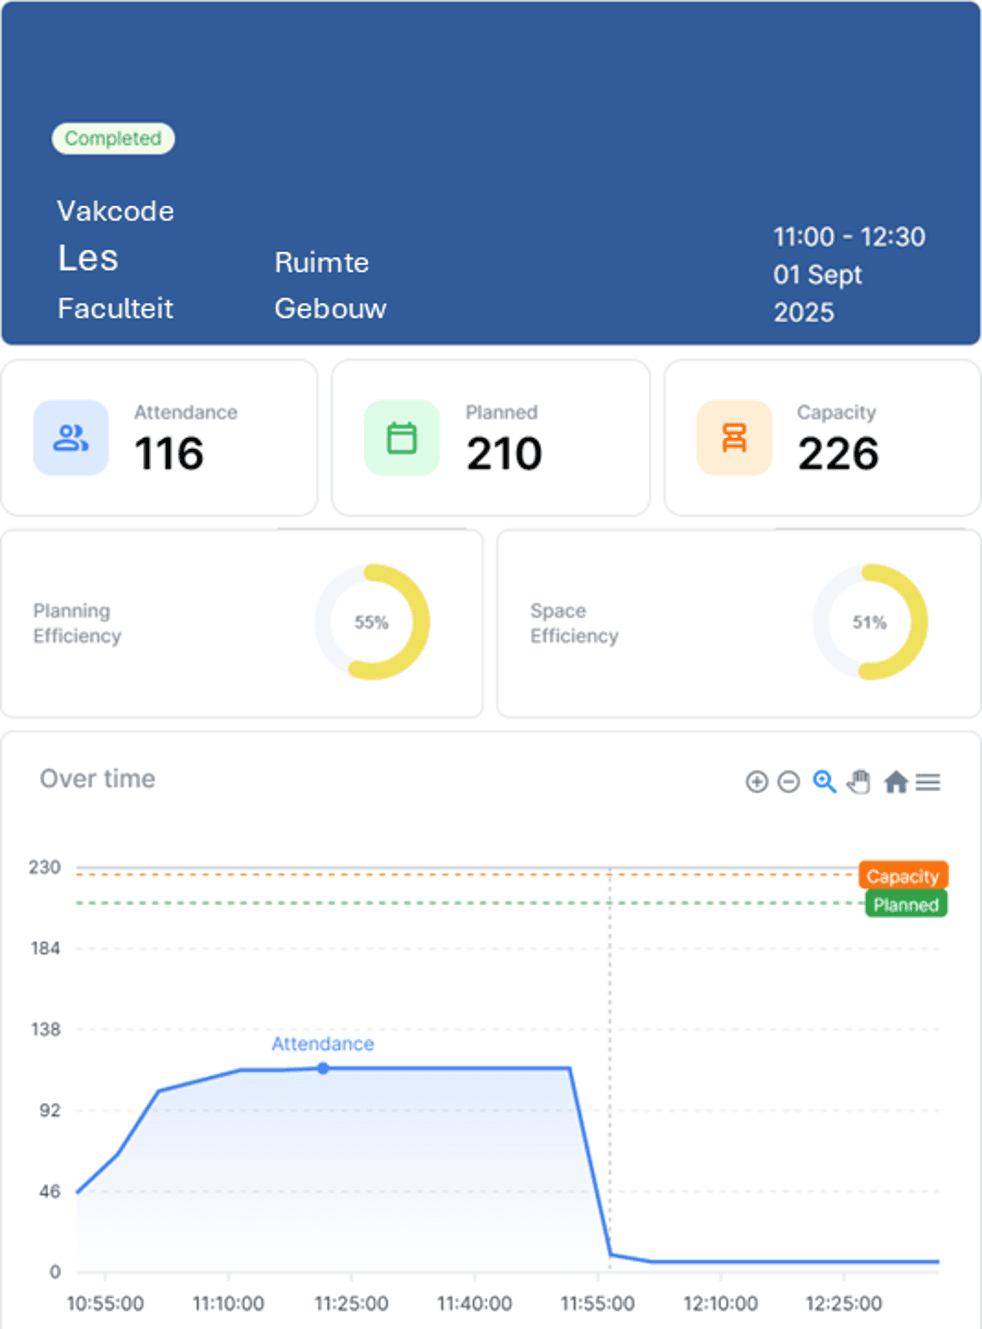
Next, we exclude the start and end of the meeting: because people move in and out of the room at these times, these counts are likely not representative of the actual number of attendees. From all the measurements, we take the measurement with the highest number of attendees to determine the occupancy of the activity.
After mapping the occupancy, we determine the frequency by looking at the percentage of time that the lesson is below a threshold of the expected group size. In the example, which has a large group size, we take a threshold of 5%. The planned group size is 210: this means if the group size drops below 10, the room is considered not to be in use anymore. In the example, the room is in use between 11:00 and 12:00, but the occupancy is below the threshold from 12:00-12:30. The frequency of this activity is therefore around 67%.
The accuracy of real-time measurements versus manual surveys
The ability to use many measurements to determine the frequency and occupancy of activities is one of the great advantages of real-time measurements versus manual surveys. If you have to rely on just one manual measurement every hour or two hours for every room, you may easily under- or overestimate both the frequency and the occupancy of each lesson. Also, within each block, you are unable to spot late starts or early finishes. For the previous example, a manual surveyor who passes by at 11:40 would come to an entirely different conclusion than at 12:00! As a result, the accuracy of real-time measurement of frequency and occupancy greatly increases when compared to manual measurement – provided that the sensor is accurate, of course.
Evaluating sensor accuracy
This brings us to the subject of sensor accuracy. Accuracy is defined as follows:
Accuracy measures how close your data comes to being correct by comparing the value of the measurement to the real value (also known as the ground truth).
Typically, the accuracy of a people counting sensor is assessed by conducting manual measurements at a specific timestamp (for example 16:03) and comparing those measurements to the measurement reported by the sensor at the same timestamp, or the nearest adjacent timestamp. However, our objective with the sensor is not to measure the people count, but to determine the occupancy of the room. Therefore, we compare the resulting occupancy number instead of just the people counts. This has the added benefit of accounting for the room size: in order to achieve the same accuracy, a sensor in a 30-seat room has a smaller margin of error than a sensor (or set of sensors) in a 500-seat capacity room.
Using the Mean Absolute Error (MAE), we’ve compared the accuracy tests of our sensors across four institutions. The table below shows the results per room size. As you can see, our sensors deliver 91-99% accurate occupancy measurements across various room sizes.
Room sizes | # of Rooms | # of Measurements | MAE | Accuracy % (1 – MAE) |
10 | 4 | 56 | 4,5% (0,45 person) | 96,5% |
16 | 2 | 97 | 8,8% (1,4 person) | 91,2% |
30 | 1 | 47 | 4,9% (1,5 person) | 95,1% |
138 | 1 | 36 | 1,2% (1,7 person) | 98,8% |
500 | 1 | 46 | 1,2% (5,8 person) | 98,8% |
With high-level accuracy estimation, you can make scheduling and real estate decisions with confidence. Would you like to know more about sensor accuracy? Leave us a message at info@pleqcampus.nl!
