
Discover the difference between utilization and occupancy of spaces: insight into space usage, current occupancy rates versus time usage, plus benefits for facilities efficiency, sustainability, and strategic planning.

Adil Ayi
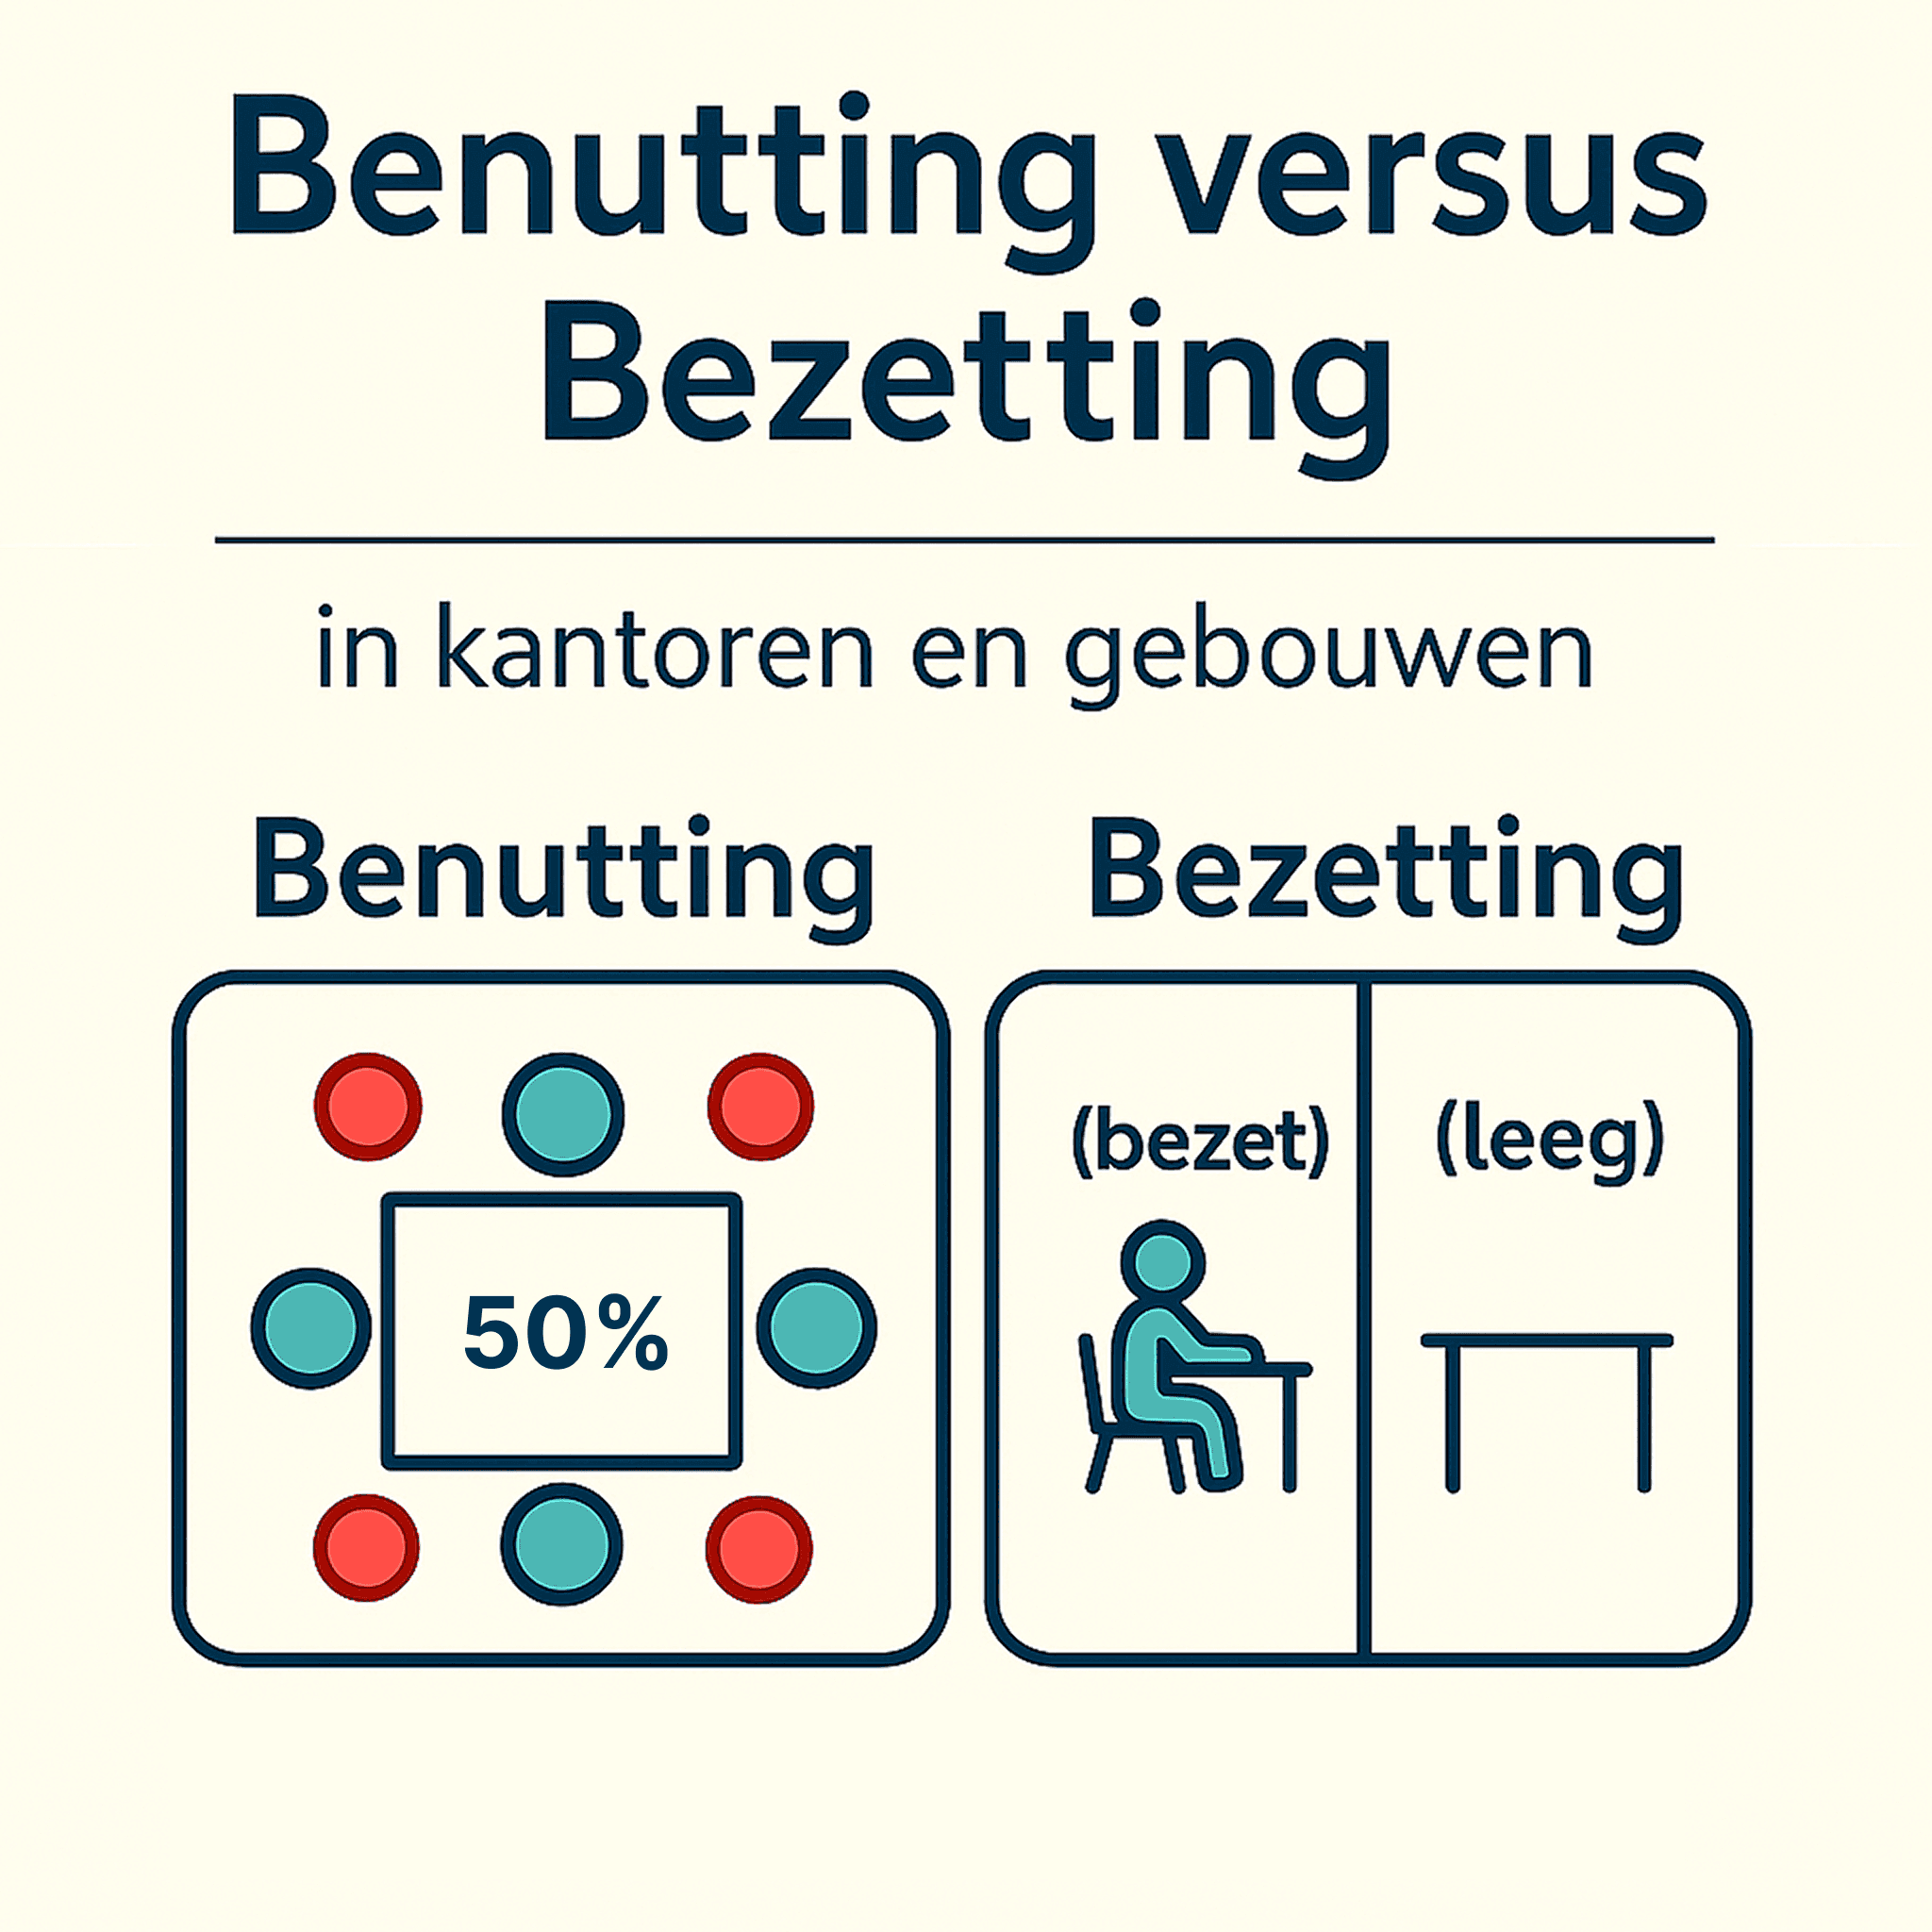
What is the difference between Utilisation and Occupancy?
In the world of Estate Planning, building management and workplace optimisation, the terms utilisation and occupancy are used regularly. Although they are closely related, they describe fundamentally different aspects of space usage. Understanding this distinction helps organisations make better decisions regarding efficiency, space layout and user comfort.
Occupancy
Occupancy describes how often a space is used over a certain period. This is not about the number of people in the space, but about the time usage of the space itself.
The corresponding term occupancy rate is usually expressed as a percentage. This indicates what percentage of the time a space is actually in use. For example:
A meeting room with an occupancy rate of 80% means that it is occupied 80% of the time — regardless of whether there are 2 or 8 people in it.
Utilisation
Utilisation, on the other hand, provides insight into the number of people present in a space at any given time. This therefore says something about the actual occupancy of the available workplaces or seats.
The corresponding utilisation rate is calculated by dividing the number of people in a space by the number of available places. This is also expressed as a percentage.
For example, as shown in the infographic below: A meeting room with 8 seats has 4 seats occupied at a certain moment. The utilisation rate is then 4/8 = 50%.
In short:
Term | Definition | Focus | Unit |
|---|---|---|---|
Utilisation | Number of people present in the building | Building and Space Level | Number (Number of People) |
Occupancy | How intensively spaces such as workstations are used | Space level | Status (occupied/vacant) |
Value for Estate Planning & Facility Management
Insight into occupancy and utilisation offers organisations concrete benefits:
Efficiency & cost savings: by identifying underutilisation, you can optimise spaces and reduce energy and maintenance costs TU Delft Research Portal+1.
Healthier & more sustainable buildings: shut down unused spaces, adjust systems to actual occupancy—good for the environment and comfort relogix.com.
Improved user experience: insight helps in designing spaces that truly align with working behaviour, such as more quiet workspaces or breakout spaces CapellaHubstar.
Strategic planning: utilisation data enables well-founded choices, such as subleasing or redesigning the office floor Hubstar.
How do you measure Utilisation and Occupancy Rate?
There are multiple ways to gain insight into how a building and the available spaces are actually used. Below is an overview of the five most commonly applied methods to measure utilisation and occupancy—each with their own advantages and disadvantages.
1. Manual counting
Advantage: Easy to start, no technology or investment required.
Disadvantage: Low accuracy, labour-intensive and only snapshots. Not suitable for continuous monitoring.
Application: Particularly useful for small spaces or short-term observations.
2. Wi-Fi / BLE tracking
Advantage: Makes smart use of existing network infrastructure such as Wi-Fi routers or BLE beacons. Scalable, affordable and quick to implement.
Disadvantage: Dependent on personal devices. One person can carry multiple devices, leading to inaccuracy.
➤ Please note: Modern AI and machine learning technologies can recognise the difference between people and devices, making this method significantly more reliable.
3. Sensors (Motion, PIR, IR, Headcount)
Advantage: Real-time detection, high accuracy and completely privacy-friendly because no image material is used.
Disadvantage: Requires investment in installation, maintenance and calibration. Sometimes dependent on battery replacement or mains power.
4. TOF sensors (Time-of-Flight)
Advantage: Very high accuracy in counting people, without using cameras. Ideal for privacy-sensitive environments.
Disadvantage: Only recognises how many people are in a space, but not who or what behaviour is shown.
5. Digital Methods
Think of workspace reservation systems, meeting room planning and digital visitor registration.
Advantage: Valuable data without extra hardware. Easily combined with other tools.
Disadvantage: Only effective if employees consistently use and register in the systems.
Comparison table: Advantages and Disadvantages per Measurement Method
Method | Advantages | Disadvantages | Accuracy |
|---|---|---|---|
Manual counting | Quick to start, no technology required | Low accuracy, labour-intensive, not continuous | ❌ Very low |
Wi‑Fi / BLE | Low investment, scalable, use of existing networks | Dependent on personal devices, interpretation required | ⚠️ Moderate – dependent on AI integration |
PIR / IR sensors | Privacy-friendly, high accuracy | Higher initial costs, maintenance-sensitive | ✅ Good |
TOF sensors | Very accurate, no camera, no privacy concerns | Only counts number of people, no behaviour or identity | ✅ Very good |
Digital reservation | Easy to integrate, user-friendly systems | Only accurate with consistent use by employees | ⚠️ Limited – dependent on usage discipline |
Safeguarding Data and Organisational Prerequisites
Measuring utilisation and occupancy delivers valuable insights—but without proper safeguarding of data and internal strategies, it remains a matter of separate measurements without sustainable impact. Organisations must therefore think carefully about the following prerequisites:
Data ownership
Ensure that your organisation always remains the owner of the collected data. Avoid vendor lock-in and choose open and transparent systems that enable integration with existing IT structures.Analytics & Data Science capacity
Insight without interpretation is worthless. Build internal knowledge by involving analytics specialists and data scientists in analysing occupancy data. This allows you to translate data into dashboards, trend analyses and action-oriented KPIs.Future-proof with AI
New AI applications such as heatmaps, space usage predictions and automatic space offering can add enormous value. (Also check out our blog on AI & building management for more on this.)UX & awareness
The user experience of dashboards and reports is crucial. If information is presented clearly and is visually appealing, it stimulates conscious behaviour and organisational change.
Conclusion: From Measuring to Improving
Measuring utilisation and occupancy is not an end in itself, but a means to make workplaces smarter, healthier and more sustainable. By investing in measurement solutions, data ownership and internal data expertise, you prepare your organisation for the future.
✅ Do you want to know more?
Check out our other blogs or contact our team. We are happy to help you find the best solution for your organisation.
